Plot Selection and Set-up
The objective of these methods is to measure whether seedlings and wildflowers are able to grow, and/or if their growth rate changes in response to reductions in deer browsing. If your property’s woodland is small (<10 acres), you will establish a minimum of six plots for each method you plan to implement. To begin, locate the plots within the same “stand” in your woods; for additional stands or for plots protected by fencing, replicate the process. Because the vegetation in one stand will react differently to changes in deer numbers and browsing intensity than the vegetation in another stand, the data need to be collected by stand. If you have a larger property and are able to devote more time to the assessment, consider establishing sets of six or more plots in each of several stands. If more than one stand type is present on your property, you may choose to establish one complete set of six plots in two or more different stand types to capture the variability in deer impacts. For instance, if you have had a recent timber harvest in one area but not in another, you could set up monitoring plots in each of those areas. If you have woods of different ages or dominated by different tree species (oak trees versus sugar maple, etc.), you could establish a set of six plots in each stand.
For either of the two methods, it is necessary to have an adequate number of plants present to measure and monitor. Before choosing plot locations, spend 20 to 30 minutes walking the stand you plan to sample. Each plot is located subjectively to ensure there are adequate numbers of plants to measure. Because this type of sampling assesses deer impacts, the selection of plants does not need to be random. Rather, selection of plants needs to ensure that plants will reflect increasing or decreasing changes in deer browsing intensity. The goal is to measure at least 25-30 plants total for each seedling or flower species you select. We recommend establishing six plots to disperse the measured seedlings and get a representative sample of deer impacts to seedlings in that stand. Each plot can have the same number of tagged seedlings or wildflowers (ex: 6 plots with 5 seedlings each = 30), or the plots can contain variable numbers of plants. A plot can contain multiple tagged species but plan for a dispersion of species to account for various patterns of deer movement within a stand. All plots should be located at least 50 feet from the forest edge where the trees meet an open field, shrubland, wetland, or other non-forest habitat type, and at least 25 feet from human disturbance (skid trail, old home site, hiking trail, road, etc.). If you are conducting the Spring Wildflower method, look for areas where the target species (Appendix A) are growing. Likewise, if you plan to implement the Woody Seedling method, look for areas with woody seedlings (trees or shrubs) between 6 inches and 3 feet tall.
Set Up Sampling PlotsFor either method, participants will establish plots with a six-foot radius. Working with a partner who can record data for you makes the sampling easier and faster. Establish as many plots as needed to include 25-30 or more plants of each species you select, but a minimum of 4 plots – ideally 6 plots for greater dispersion. Each plot center should be located at least 25 feet from the center of any another plot. Select a location and mark the plot center using a 2-foot long piece of pvc pipe that is 1 inch in diameter, or a short wooden stake, heavy duty plastic stake (www.forestry-suppliers.com or https://www.berntsen.com/Surveying/Survey-Stakes) or fiberglass rod (Figure 1). PVC is inexpensive and lightweight to carry. You can paint the top of the stake with tree-marking (or other) paint to make it more visible or wrap it in brightly colored duct tape. If possible, record the GPS location of each plot center in latitude and longitude (decimal degrees format) and write the plot numbers on your stakes using a metal tag, permanent marker or another long-lasting method.
Permanent markers will fade and will need to be refreshed annually. It is also a good idea to draw a map of your plots on your data sheet and write the numbers on the map in case the numbering in the field fades or is lost. Marking an access trail with surveyors flagging or other material is helpful (and sometimes essential) for relocating plots.
Plots will have a 6-foot (2 yard) radius (Figure 2). You can use two yardsticks, or any stick cut to a 6-foot length. You can also use a 6-ft string tied to the center post or tied to a pill bottle that sits over the center post (Figure 3) and can rotate. The plot edge can be marked with small sticks or other objects around the edge to help you visualize the outer limits of the plot. It is important to avoid trampling the vegetation within the plots you establish. These plots will be resampled over time and plants can be damaged by trampling, affecting the validity of your results.
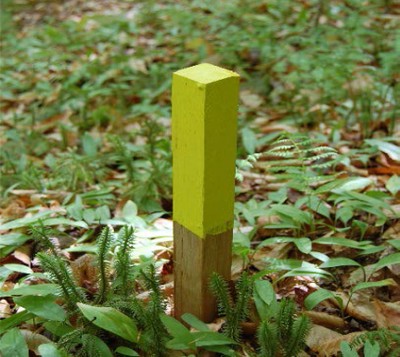
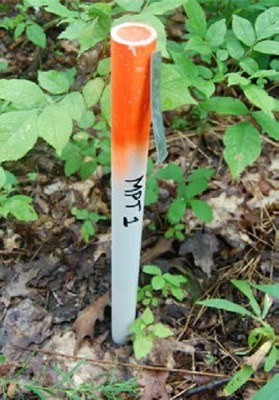
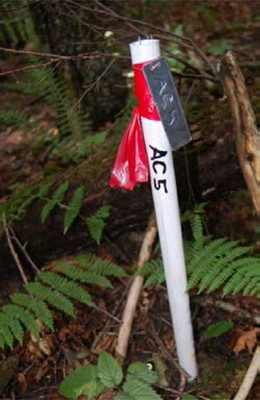
Figure 1. Mark your plot centers with pvc pipe, a wooden stake or rebar. Mark the stake using brightly colored paint, surveyors flagging or brightly colored duct tape to make it easy to relocate. Permanent markers can fade – refresh your plot numbers annually.
Plots will have a 6-foot (2 yard) radius (Figure 2). You can use two yard sticks, or cut any stick to a 6-foot length. The plot edge can be marked with small sticks or other objects around the edge to help you visualize the outer limits of the plot. It is important to avoid trampling the vegetation within the plots you establish. These plots will be re-sampled over time and plants can be damaged by trampling, affecting the validity of your results.
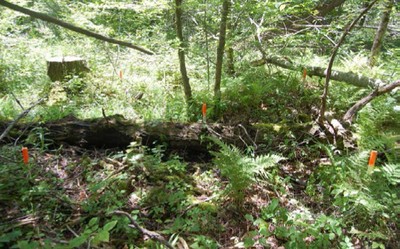
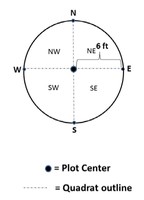
Figure 2. Schematic and picture of one plot showing 6-foot radius and four quadrants. Each quadrant is established by measuring six feet to the edge of the plot and marking the plot edge at each of the four cardinal directions.
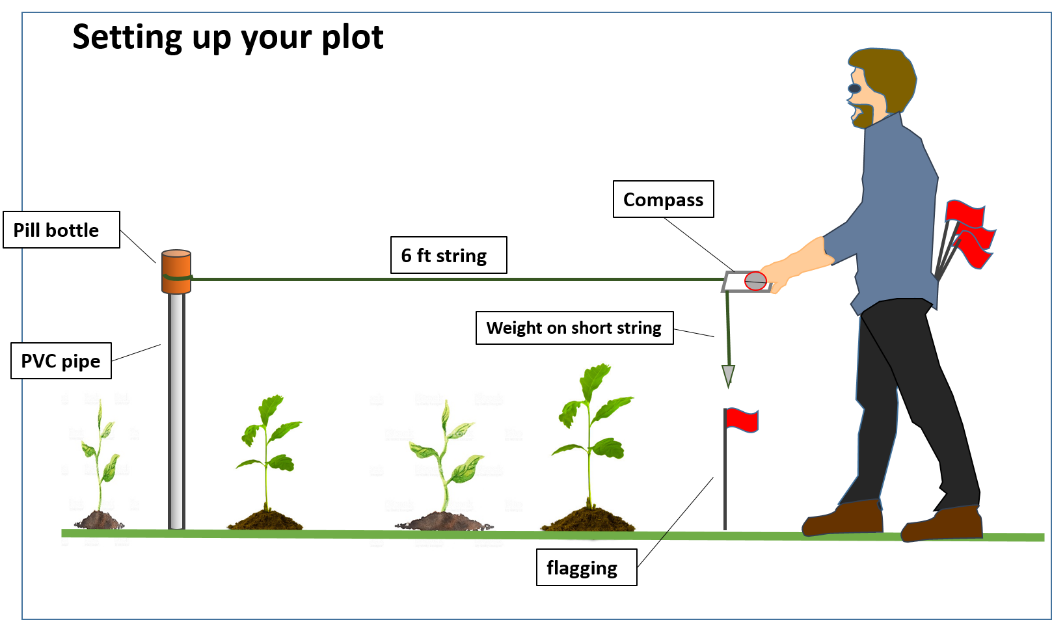
Figure 3. A pill bottle or something similar can be attached to a 6-foot string and slipped over a pvc plot stake. The bottle will turn as you walk around the circle, finding the cardinal directions and marking them with ease (graphic courtesy of Steve Kinne).
Pacing to Measure DistancePacing is a reasonably easy and quick method of measuring distance in the field. One pace is defined as two footsteps walking at a natural pace. Twelve paces should cover 50 feet even for individuals with a very short stride. Therefore, if you don't have a long measuring tape or do not wish to carry one afield, you can walk 12 paces from any forest edge or disturbance. Six paces would represent an adequate distance between plot centers.
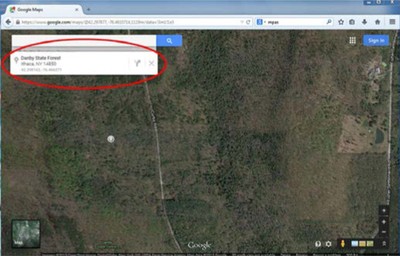
Using Google Maps to Find Latitude and Longitude – An Alternative to a GPSIf you do not own a GPS unit there is another easy way to find the coordinates for your site location. If you search the internet for Google Maps, you can zoom into the location where your site is located. Clicking the spot on the map will show the coordinates (latitude and longitude) in the box that appears underneath the search bar. You can then copy the latitude and longitude onto your data form.There are several ways to report latitude and longitude. Please record it as "decimal degrees". To set your Google Maps to decimal degrees go to Tools>Options>3D view and select "decimal degrees".
Figure 2. Schematic and picture of one plot showing 6-foot radius and four quadrants. Each quadrant is established by measuring six feet to the edge of the plot and marking the plot edge at each of the four cardinal directions.
Pacing to Measure DistancePacing is a reasonably easy and quick method of measuring distance in the field. One pace is defined as two footsteps walking at a natural pace. Twelve paces should cover 50 feet even for individuals with a very short stride. Therefore, if you don't have a long measuring tape or do not wish to carry one afield, you can walk 12 paces from any forest edge or disturbance. Six paces would represent an adequate distance between plot centers.
Using Google Maps to Find Latitude and Longitude – An Alternative to a GPSIf you do not own a GPS unit there is another easy way to find the coordinates for your site location. If you search the internet for Google Maps, you can zoom into the location where your site is located. Clicking the spot on the map will show the coordinates (latitude and longitude) in the box that appears underneath the search bar. You can then copy the latitude and longitude onto your data form.There are several ways to report latitude and longitude. Please record it as "decimal degrees". To set your Google Maps to decimal degrees go to Tools>Options>3D view and select "decimal degrees".